6-Part Blog Series: The Role of High-Performance Coatings in Shrinking the Carbon Footprint
In part three of this blog post series, we began our discussion on how to evaluate the volatile organic compounds (VOCs) produced by high-performance industrial coatings, as well as the data points related to VOCs that are commonly used when choosing an industrial coating system.
In this next blog post, we will take a deep dive into the key data points that should be understood by specifiers and environmental, health and safety (EH&S) personnel who select and approve industrial coatings in order to accurately forecast VOC emissions.
Let’s start out by evaluating paint emissions. A good way to estimate total VOC emissions is in the same way that estimators price out a paint job. When evaluating different paint systems in a coating specification, estimators always ask two questions: what is the cost per gallon, and what is the percentage of volume solids? Because the specified dry film thickness (dft) of a coating is already provided in the specification, these additional data points allow estimators to calculate and compare the costs per square foot, or square meter, of the coating systems.
Calculating Cost Per Square Foot
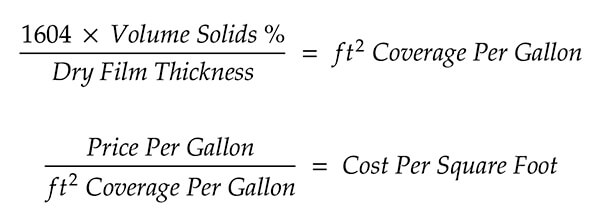
To calculate the cost per square foot, multiply the theoretical coverage of a liquid at 1 mil (or 1604²) by the volume solids percentage of the coating, then divide the result by the specified dft in mils. This provides the coverage rate of a paint at the specified film thickness after the evaporation of solvents.
Next, divide the cost per gallon by the square-foot coverage of the coating to determine the theoretical cost per square foot, as shown below:

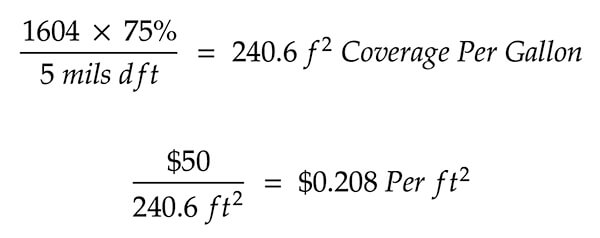
For example, let’s calculate the theoretical cost per square foot for a coating that has been specified to achieve 5 mils dft. The coating has a volume solids of 75% and has been quoted at $50 per gallon.

So, we can multiply our theoretical cost per square foot—20.8 cents—by the total estimated square footage of the job to determine our material costs, right? Not quite.
Theoretical Versus Practical Application Rates
Most readers have probably picked up on the repeated use of the word “theoretical.” This is because the theoretical cost per square foot assumes a 100% transfer of the coating from the bucket to the surface being coated—which we know is impossible. For instance, depending on the application method, some paint could be lost to overspray or even left embedded in the roller or brush.
In the industrial coatings industry, this is usually referred to as either the “loss factor” or “consumption rate.” Regardless of the terminology, a practical coverage rate is needed in order to estimate a more realistic cost per square foot.
The loss rate of a coating application typically ranges from 10% to 40%, depending on the application method and geometry of the structure being painted. Estimators should know the loss factor to plug in for the type of project they are estimating.
Taking our above theoretical coverage rate per gallon (240.6 ft²), and let’s say a 25% loss is expected for this type of job. Based on this, what is the practical coverage rate?

When the cost per gallon of $50 is divided by the practical coverage rate of 180 ft², the cost per square foot equals out to $0.277 per square foot.
Other factors certainly come into play when applicators select a coating system, such as ease of application and service level of the manufacturer. However, every estimator who prices out jobs should be able to tell you to the penny—or even the tenth of a penny—the estimated material cost per square foot.
Calculating VOC Emissions by Coverage Rates
VOC emissions per square foot can be estimated in a similar way to cost per square foot. Start by calculating the coverage rate per gallon, as shown above. However, instead of dividing the cost per gallon by the coverage rate, you’ll divide the VOCs lbs per gallon (as stated on the product data sheet) by the coverage rate in order to get the VOC emissions per square foot.

The result will be a very small figure. For example, if a coating has 3 lbs VOCs per gallon with a 250 ft² coverage rate, the VOC emissions per square foot is 0.012 lbs. When the VOCs per gallon are multiplied by the square footage of the coated item—or average annual square feet coated in a maintenance program—we can then see the impact.
For instance, a project with 10,000 ft² coated with the above sample product at 0.012 lbs would have 120 lbs VOC emissions per 10,000 ft2, as shown below. It adds up quick!

A Solvent Based System Versus a Waterborne System
Now, let’s compare two coating systems and their estimated annual VOC emissions. The below illustration is based on a petrochemical facility that decided to only permit waterborne coatings on site in order to reduce VOC emissions and eliminate the need to store paint thinners.
On an aggressive year for maintenance painting, we’ll assume this facility could paint 500,000 ft² with its standard maintenance coating system. Let’s estimate the forecasted VOCs using the standard epoxy-urethane system, compared to the proposed water-based, epoxy-acrylic finish system.
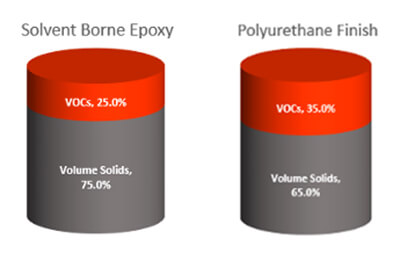
The Epoxy-Urethane System

The above illustration depicts the VOCs and volume solids of a solvent-borne coating system by volume. The volume solids remain after solvents—in this instance, VOCs—evaporate out of the coatings.
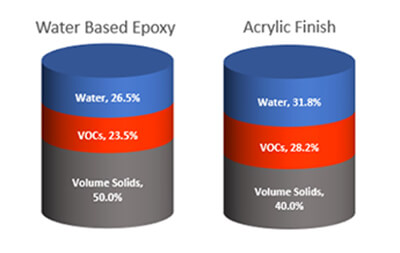
The Waterborne System

Many waterborne coatings also have VOCs that contain solvents, in addition to the water. The above illustration depicts the amount of VOCs, water and volume solids of a coating by volume.
The Importance of Solids by Volume
While the VOCs per gallon on the product data sheet for waterborne coatings may be lower, the question is—will those lower VOCs lbs per gallon translate to lower overall emissions for the customer?
Let’s round off the values of each product to an industry average, using generic coatings to compare a solvent-borne maintenance system to one that is waterborne.
| System A: Solvent-Borne Maintenance System | ||
|---|---|---|
| Epoxy Mastic: | 75% Volume Solids | 1.8 lbs VOCs Per Gallon |
| Polyurethane: | 65% Volume Solids | 2.7 lbs VOCs Per Gallon |
| System B: Waterborne Maintenance System | ||
| Water-Based Epoxy: | 50% Volume Solids | 2.0 lbs VOCs Per Gallon |
| Acrylic Finish: | 50% Volume Solids | 1.5 lbs VOCs Per Gallon |
The initial comparison shows the water-based epoxy as slightly higher in VOCs per gallon than the solvent-borne epoxy. However, the acrylic finish in the waterborne system is significantly lower in VOCs per gallon than the polyurethane finish. That said, what really jumps out is volume solids percentage of the coatings in each of the two systems.
The owner specified the same dft for each system. How, then, will the lower volume solids affect the coverage rate, total quantities used and resulting VOC emissions?
On average, this facility coated approximately 500,000 ft² per year in maintenance paint. The most common system was a “spot, full, full” system for atmospheric service.
| Spot Primer: | Epoxy | @ 4-6 mils dft |
|---|---|---|
| Intermediate: | Epoxy | @ 4-6 mils dft |
| Finish: | Polyurethane | @ 2-3 mils dft |
The coating applicator would first wash the structure to be painted, perform spot surface preparation on the degraded areas and spot prime with epoxy mastic. Then, the applicator would apply a full intermediate/tie coat of epoxy mastic, followed by a full coat of polyurethane.
For spot repair systems, the estimators found that 30% of the total square footage to be coated was the ideal figure for estimating square footage of the spot primer. With that in mind, this is how we would calculate the total annual paint usage:
| Spot Prime: | 500,000 ft² x 30% = 150,000 ft² |
|---|---|
| Full Intermediate: | 500,000 ft² |
| Full Finish: | 500,000 ft² |
From this data, we can estimate the total gallons needed for the two maintenance systems based on various coating types, assuming a 20% loss factor:
| Total Gallons Needed for System A (With 20% Loss Factor): | ||
|---|---|---|
| Epoxy Mastic | 75% Volume Solids | 650,000 ft² @ 5 mils dft = 3,380 gal |
| Polyurethane | 65% Volume Solids | 500,000 ft² @ 2 mils dft = 1,200 gal |
| Total Gallons Needed for System B (With 20% Loss Factor): | ||
| Water-Based Epoxy | 50% Volume Solids | 650,000 ft² @ 5 mils dft = 5,065 gal |
| Acrylic Finish | 40% Volume Solids | 500,000 ft² @ 2 mils dft = 1,950 gal |
Next, let’s take a look at the total estimated VOCs for each maintenance system:
| System A: Solvent-Borne | |
|---|---|
| 3,380 gal x 1.8 lbs VOCs per gal | 6,084 lbs VOCs |
| 1,200 gal x 2.7 lbs VOCs per gal | 3,240 lbs VOCs |
| Total: | 9,324 lbs VOCs |
| System B: Waterborne | |
| 5,065 gal x 2.0 lbs VOCs per gal | 10,130 lbs VOCS |
| 1,950 gal x 1.5 lbs VOCs per gal | 5,715 lbs VOCs |
| Total: | 15,845 lbs VOCs |
The Addition of Thinners
When looking at the “environmentally friendly” waterborne system, the total VOCs are significantly higher than those of the solvent-borne system. However, there is a critical component missing from this calculation—the paint thinners required for solvent-borne systems. Because thinners for solvent-borne coatings are typically 100% VOCs, this can significantly add to the total.
Though required solvent use is lower for many of today’s coatings, we will use the estimators’ old rule of thumb for this example—that there should be approximately 10% more gallons of paint thinners than the total paint gallons purchased. So, if 100 gallons of solvent-borne paint are needed, that will add 10 gallons of paint thinners to the order.
But how does the addition of solvents change the comparison between the solvent-borne and waterborne maintenance systems? Most solvents are about 7.1 lbs VOCs per gallon. Based on this, below are the total estimated VOCs for each system with solvents added:
| System A: Solvent-Borne | |
|---|---|
| 3,380 gal x 1.8 lbs VOCs per gal | 6,084 lbs VOCs |
| 1,200 gal x 2.7 lbs VOCs per gal | 3,240 lbs VOCs |
| 4,580 gal x 10% x 7.1 lbs VOCs per gal | 3,252 lbs VOCs |
| Total with Solvents: | 12,576 lbs VOCs |
| System B: Waterborne | |
| 5,065 gal x 2.0 lbs VOCs per gal | 10,130 lbs VOCS |
| 1,950 gal x 1.5 lbs VOCs per gal | 5,715 lbs VOCs |
| Total: | 15,845 lbs VOCs |
With the addition of paint thinners used to reduce the solvent-borne coatings, the totals of the two systems are much closer. However, in this case, the solvent-borne system is still about 20% lower in VOC emissions than the waterborne system—a significant difference.
The point of this explanation is that VOCs should be treated like a cost by coating professionals to help customers properly plan and budget. All key stakeholders—especially HS&E personnel—should have the information and tools needed to make informed decisions. Our responsibility goes beyond simply manufacturing a coating that meets the allowed VOCs per gallon in a specific region.
In part five of this blog post series, we will explore the impact of the “human factor” and the life cycle of an industrial coating system on lowering VOC emissions.

